The Drop Zones panel features several different types of drop zones; each zone drives a corresponding component in the visualization, and vice-versa, The selected visualization determines which drop zones will appear. For example, the grid visualization enables the Rows and Columns zones, while Cartesian charts enable the Category zone.
Drop Zones
There are two circumstances in which a Drop Zone panel is shown in Tabulate:
- Where some or all of your tabulation has been "visualized" on the right-click (as in the example below). In this case, there may be multiple visual types; in which case you need to select the visual you are interested in to open its Drop Zones panel. For more information, see Creating Tabulate Visuals.
- Where you are interacting with linked discovery data in your tabulation. In this case, you see a simplified drop zone. For more information, see Working with discoveries in tabulations
- To learn more about how the drop zones drive a visualization click here.
Deriving the Chips in the Drop Zone
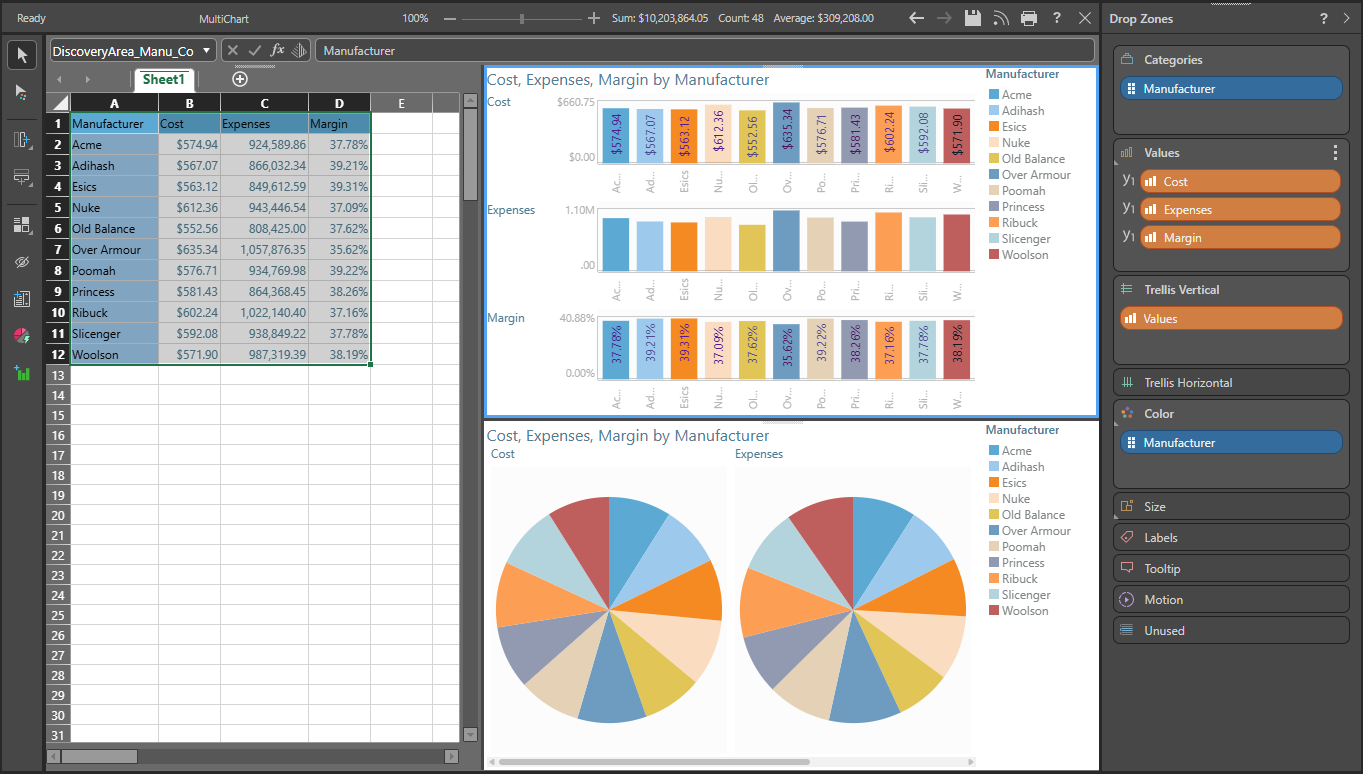
The orange and blue "chips" in the Tabulate drop zones are pivotal elements - allowing you to position different parts of the data set into different elements of the chosen visual - like categories, series (or color), labels, tooltips and the values themselves.
- The value items - or orange chips - are derived by looking at elements in the selected visual range and heuristically determining the values of the selection. Usually these are the columns in the area when its a classic grid (see example above)
- The categorical or attribute items - or blue chips - are derived by looking at the elements in the selected visual range and heuristically determining the non-value elements of the selection. Usually these are the rows in the area when its a classic grid (see example above)
The chips are then presented to users in the drop zones based on these derivations - and are automatically placed in drop zones (right side of image above). You can switch these around to adjust the visual or use the "Unused" drop zone item (specific to Tabulate visuals) to discard selections from your visual.